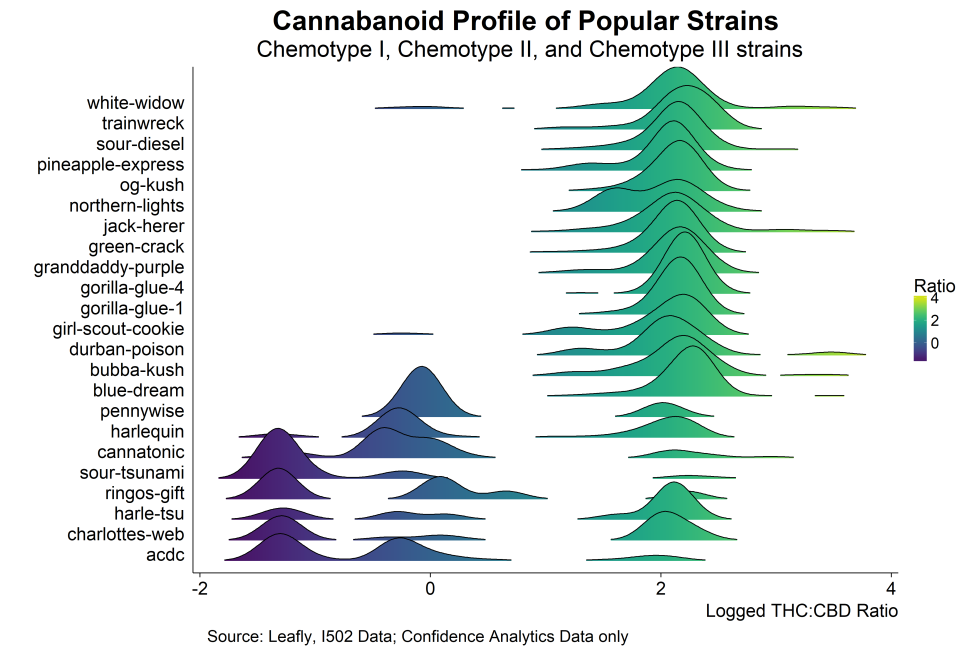
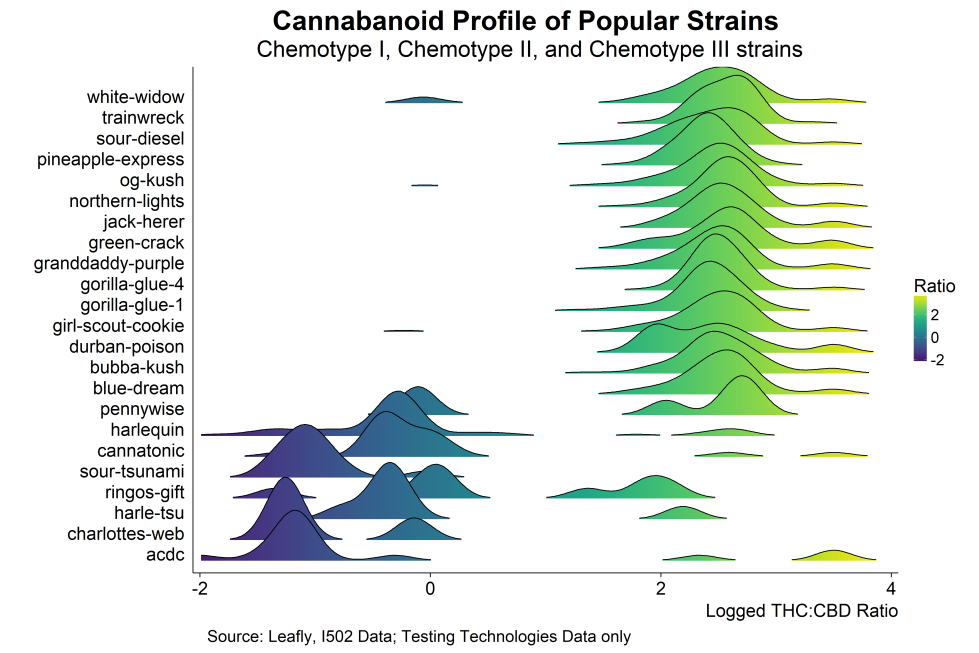
Using the I-502 data from Washington State and the ggridges library in R can make some fun graphics. In my paper with Nick, we show the distribution of logged THC:CBD ratio, by strain, for 30 or so popular strains (according to Leafly review data) for two labs — Confidence and Peak. Here are those plots for all six of the big labs.